
The sizeable valuation gap which currently exists between public and private real estate is perhaps the largest in history, potentially making the current environment one of the best for investors to increase or initiate exposure to publicly traded real estate. For clarification purposes, we will define public real estate as a listed or traded Real Estate Investment Trust (REIT) which is a company that owns, operates or finances income-producing real estate. These companies must meet certain requirements to qualify as REITs. And as implied by the term “listed” or “traded”, these REITs have common shares that trade on stock exchanges with the most common being the New York Stock Exchange (NYSE). For discussion purposes, private real estate relates to private real estate funds or REITs that are non-traded. In either case, returns are not market-based, but are calculated monthly or quarterly, usually predicated upon an appraisal or similarly derived private market valuation methodology.
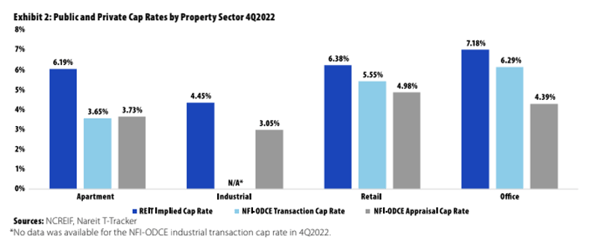
One simple valuation tool for describing and comparing real estate values is the implied capitalization (cap) rate which is equivalent to the net operating income of the real estate divided by the “implied” value of the real estate. Implied cap rate is to real estate, as the price-to-earnings ratio (P/E) is to traditional common stocks and thus is a good starting point for thinking about value on an absolute and relative basis. Traded REITs, like their listed c-corp brethren, can be thought of as forward discounting mechanisms which are pretty good at capturing and pricing market risks and expectations in an efficient manner – think efficient market hypothesis. As such, traded REIT pricing was quick to reflect the changing interest rate path put forth by the Federal Reserve in early 2022 when interest rates were still low, and inflation began to ramp up. With REIT implied cap rates significantly higher than private real estate transaction and appraisal cap rates, the attractiveness of publicly traded REITs has increased, and REITs offer investors access to institutional quality properties with best-in-class operators at substantially discounted prices relative to the private market. [i]
The notion of mean reversion, which is a theory that suggests that asset price volatility and historical returns eventually will revert to the long run mean or average level of a dataset is well documented in the study of public and private real estate. The analysis shows that publicly traded REIT total returns have tended to bounce back – and even surge – after extreme periods of REIT total return underperformance relative to the private market.[ii] A recent study by Ed Pierzak, SVP-Research at the National Association of Real Estate Investment Trusts (NAREIT) not only demonstrates the large divergence in implied cap rates for public REITs relative to private real estate over the course of the past year, but Pierzak’s analysis also goes down to the sub-sector level and quantifies a large divergence in cap rates for the apartment sector of approximately 250 basis points (comparing listed apartment REIT implied cap rates to NFI-ODCE appraisal cap rates for apartments) and a 140 basis point differential within the industrial sector (using the same methodology).
Stepping back from the cap rate discussion, Pierzak’s analysis also looks at the depth and duration of total return divergence for public versus private real estate. In the third quarter of 2022, the FTSE Nareit All Equity Index and the NFI-ODCE posted rolling four-quarter total returns of –16.3% and 22.1%, respectively – a difference of –38.4%. This delta marked the most significant degree of REIT relative underperformance in the history of the indices. [iii]
When Pierzak looked at a time series of FTSE/Nareit and NFI-ODCE returns going back to 2000, the analysis identified eight trough periods with –10% or greater REIT relative underperformance. The analysis went on to reveal a pattern in which public/private return differences rebounded significantly after the identified troughs. The 1Q 2009 trough during the depths of the global financial crisis was followed by a surge in total return for listed REITs of 106.7% in the next year.[iv] The 3Q 2022 underperformance of REITs was even larger than that witnessed in 2009 and while it is too soon to know how this period’s divergence will end, we have seen some stabilization in the traded REIT market in the first half of 2023.
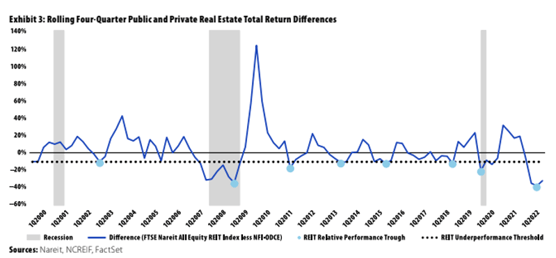
In considering the duration of the large public/private deviations which have occurred since 2003, the total return differences that fell within a -10% to –30% band had an average duration of traded REIT underperformance which lasted four quarters. The 2009 trough which ended in a differential of –34.8% resulted in a nine-quarter dislocation.
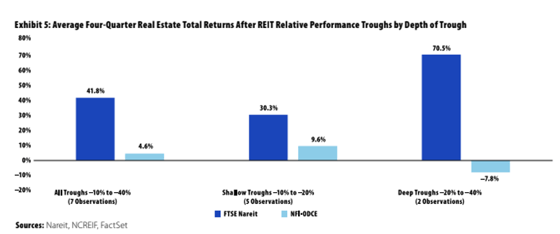
In Pierzak’s final iteration of the data, he considered average four-quarter returns after the relative performance troughs and the analysis showed traded REITs outperformed private real estate for the seven known observations by a considerable margin, with listed REITs achieving an average return of 41.8% compared to 4.6% for private real estate. The analysis goes on to show that the observations with the deepest troughs for listed REITs went on to produce greater observed forward four quarter total returns.
In conclusion, we highlight that the recent divergence in total return between listed REITs and private real estate as measured by the NCREIF Fund Index – Open End diversified Core Equity (NFI-ODCE) has never been larger and listed real estate is trading at a substantial valuation discount to its private market peers. Historically, listed REIT total returns have also tended to bounce back – and even surge – after significant public and private real estate market dislocations.[v] We would also emphasize that asset quality, operating capability and leverage profile of the listed REITs are in many cases on par with the characteristics exhibited by private market constituents,[vi] making it a very interesting time to focus on listed real estate.
To get our REIT commentary delivered directly to your inbox, sign up here.
Definitions:
Price/Earnings Ratio – the ratio for valuing a company that measures its current share price relative to its per share earnings
Basis point – a unit of measurement in finance that is equal to one hundreth of one percent or 0.01%
NCREIF Fund Index – Open End Diversified Core Equity (NFI-ODCE) is an index of investment returns of the largest private real estate funds pursuing lower risk investment strategies utilizing low leverage and generally represented by equity ownership positions in stable U.S. operating properties diversified across regions and property types
Delta – a ratio that shows how much the price of a derivative or securitiy is likely to move based on the price change of an underlying asset or proxy
Duration – a measure of the sensitivity of the price of a bond or other instrument to a change in interest rates or other factors. It is used in the assessment of the price volatility of a security
Footnotes:
[i] Public and Private Real Estate: Divergences, Harbingers, and Opportunities by Edward F. Pierzak; PREA Quarterly, Spring 2023
[ii] Pierzak
[iii] Pierzak
[iv] Pierzak
[v] Pierzak
[vi] Pierzak