.png?width=514&height=269&name=Armada%20(1).png)
The U.S. industrial real estate market is expected to see rising vacancy rates at the national level with Costar Group projecting 476 million square feet of deliveries over the next 12 months and approximately 300 million square feet of net absorption, implying that vacancy levels will rise modestly from current levels, but remain well below historic levels. The torrid pace of rent growth experienced over the past several years should also moderate as retailers and wholesalers are pausing further inventory accumulation out of caution over the economic outlook. Pundits believe the pause in fundamentals will be relatively short-lived as construction starts on new industrial projects have also been plummeting since last fall, with developers increasingly concerned that higher interest rates are causing values of newly delivered projects to dip below replacement costs. The pullback in starts signals that by spring 2024, the number of new projects completing construction each quarter should begin to decline. This could set the stage for vacancies to tighten again by late 2024 and for rent growth to potentially reaccelerate.[i]
With the recent launch of Private Real Estate Strategy via Liquid REITs ETF (PRVT), investors will be exposed to a sizeable allocation to industrial real estate which has been a cornerstone investment for several non-traded REITs. As of 1Q23, the Blackstone Real Estate Investment Trust (BREIT), a non-traded REIT, held a 23% weight to industrial real estate equity having amassed an owned portfolio of 3,255 properties aggregating 452 million square feet with a gross asset value of $27.5 billion. BREIT began buying industrial property at its inception in 2017 and was a highly aggressive purchaser in 2019 and 2021, having taken a pause in 2020 following the onset of the pandemic. Industrial real estate is also a large segment of their unconsolidated entities in which they own varying interests in more than 12 ventures for a book value of $4.0 billion.[ii] BREIT also disclosed that they anticipate continued secular demand from e-commerce and the “onshoring” of supply chains. Vacancy levels in BREITs industrial portfolio dropped to 2.5% in 1Q23 compared to 3.4% in 1Q22 and the portfolio benefited from rent increases of 37%.
PRVT was conceived with a 25% weight to the industrial REIT sector, with Prologis Inc. (PLD) selected as the centerpiece holding at a weight of approximately 8%. The industrial REIT category has been a stellar performer within the REIT space for the last ten years having outperformed the broader REIT benchmark as measured by the FTSE-NAREIT Equity REITs Index, on a compound annual total return basis for the 1YR, 3YR, 5YR and 10YR periods.[iii]
PLD reported strong 1Q23 results which included a modest increase to already positive expectations for 2023. Market rents across the U.S. continue to move higher and construction deliveries are expected to potentially peak over the coming quarter. Portfolio occupancy was 98% at the end of the period, flat versus the end of 2023. As a sign of substantial embedded cash flow growth, the company reported that lease mark-to-market expanded to 68% in the quarter, implying that even if rent growth flattens out from here, there is still visible growth for income and the dividend as in-place rents get marked up to market levels as leases expire and roll-up. The company also reported record same-store operating metrics in 1Q23 as NOI increased 11.4% on a cash basis. PLD echoed other sources in commenting that the national vacancy rate for industrial may rise modestly in the second half of 2023 as new supply gets absorbed but vacancy levels could come back down in 2024.[iv]
The PLD platform differentiates itself in several ways, one being that it is a global business with 86% of net operating income (NOI) coming from U.S. markets with the balance generated in Europe and Asia. The sheer size of the platform also distinguishes PLD from the pack as the company boasts over $200 billion in assets under management (AUM) across 1.2 billion square feet of property on four continents. PLD has an equity market capitalization of $118 billion and a credit rating of A3 and A by the rating agencies Moody's and Standard and Poor’s, respectively. At the end of 1Q23, the company reported a debt/gross real estate value ratio of 29.6% and floating rate debt as a percentage of total debt was a low 7.6%. Also, aside from the owned real estate business which generates over $5.0 billion of recurring annual NOI, approximately 10% of funds from operation (FFO) comes from the Strategic Capital business which manages private real estate funds on behalf of institutional investors. Finally, the company has an extensive industrial development capability allowing for substantial value creation opportunities across markets.[v]
The distinguishing characteristics exemplified by PLD have resulted in solid long-term financial results as measured by several important factors including FFO growth, dividend growth and retained cash flow. The company has outperformed REIT indices such as the FTSE-NAREIT Equity REIT Index over a three-year and five-year basis for per share FFO compound annual growth (CAGR) and per share dividend CAGR while generating $1.0 billion of free cash flow after dividends in 2022.[vi]
The success of PLD’s size, scale and efficiency not only translates into earnings and dividend growth, but also a low-cost operating structure which accrues to shareholders as well. PLD’s adjusted general and administrative expense (G&A) as a percentage of its gross book value assets under management has decreased materially since 2011 having dropped from 0.85% to 0.33% for 1Q23. The company’s G&A-to-AUM also looks very attractive.[vii]
In closing, we believe PLD represents an example of a large cap, best-in-class, listed-REIT that is dedicated to a single property sector and could be considered as a core holding in the buildout of a targeted and thematic investment allocation process to approximate direct real estate.
Holdings Subject to Change. For a complete list of Fund holdings, please visit:
https://www.armadaetfs.com/prvt
Free Cash Flow – free cash flow is the cash a company or entity generates after taking into consideration cash outflows that support its operations and maintain its assets.
PRVT will invest in REITs and mortgage-backed securities that, in the determination of Armada ETF Advisors LLC, the Fund’s subadviser, have similar qualitative characteristics to the aggregate real estate portfolio holdings of a select group of public, non-traded REITs. Non-traded REITs are real estate funds whose shares do not trade on stock exchanges. Rather, they generally can be sold only to accredited and institutional investors.
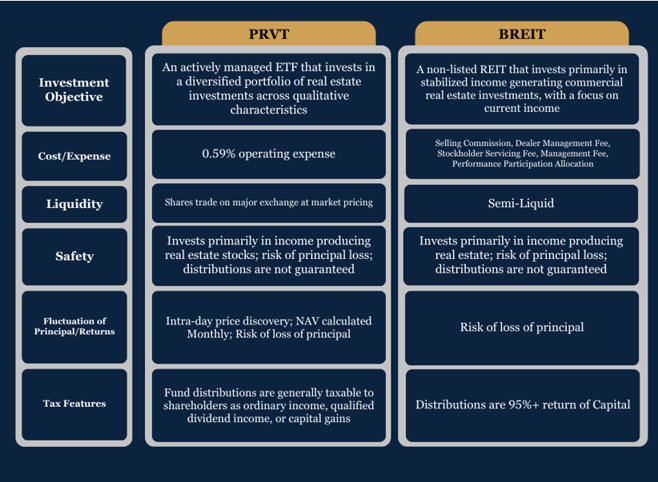
PRVT & BREIT COMPARISON CHART
LINKS:
BREIT Performance www.breit.com/performance/
BREIT Prospectus www.breit.com/stockholders/
PRVT Performance www.armadaetfs.com/prvt
PRVT Prospectus www.armadaetfs.com/wp-content/uploads/2023/06/prvt-pro_060223.pdf
To get our REIT commentary delivered directly to your inbox, sign up here.
Footnotes:
[i] Costar Group: United States Industrial Overview – June 16,2023
[ii] BREIT: 1Q223 10-Q
[iii] NAREIT: Return Data as of June 7, 2023
[iv] Prologis Inc. - 1Q23 Financial results
[v] Prologis Inc.: NAREIT Presentation – June 5, 2023
[vi] Prologis Inc.: NAREIT Presentation – June 5, 2023
[vii] Prologis Inc: NAREIT Presentation – June 5 2023