 August Prices Decreased
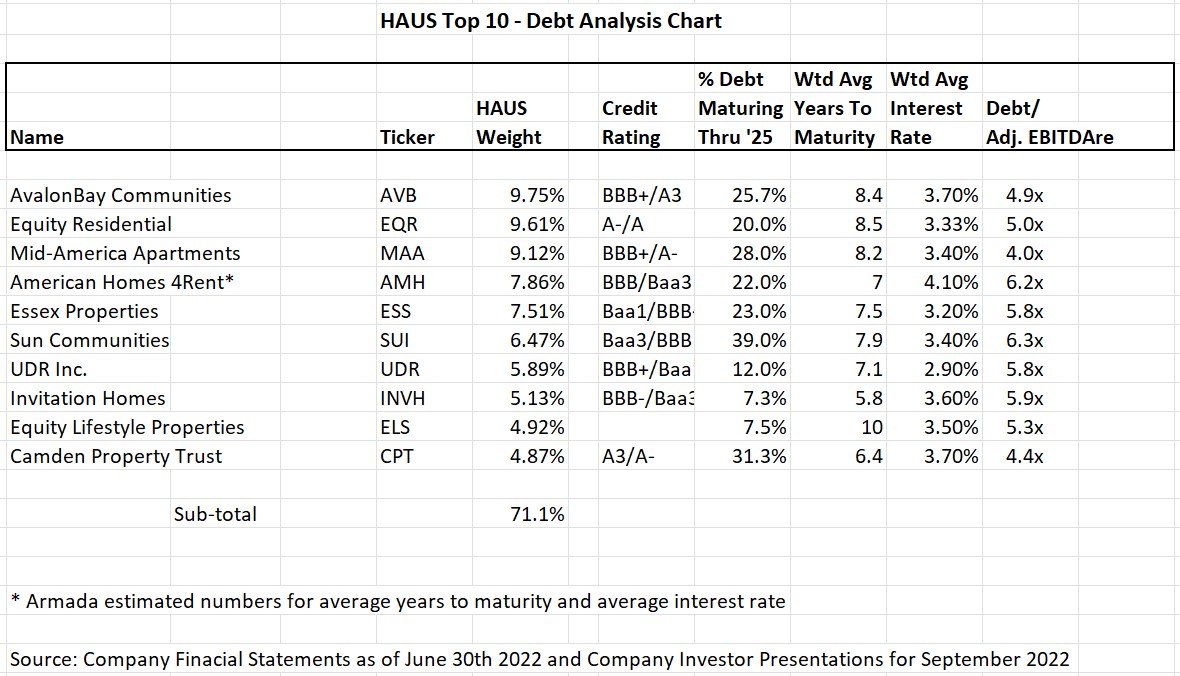
With 10-year treasury yields now approaching 4%, August housing data showing the first signs of home prices moving lower after a ten-year bull market, and sequential asking rents in several major metro apartment markets turning down for the first time since the pandemic-driven reopening of the economy, we are shedding some light on the balance sheet characteristics of the Top 10 holdings (constituting roughly 70% of the total portfolio) within HAUS.
Coastal Apartment Companies
The coastal apartment companies within the Top 10 represent just over 32% of the portfolio and all four names have investment grade credit ratings of BBB+/Baa1 or higher, with Equity Residential (EQR) the highest at A-/A. EQR has just over 20% of its debt maturing through 2025 and 42% of its debt will not mature until 2030 or beyond for a weighted average year- to-maturity of debt in excess of 8.5 years. The weighted average interest rates across EQR’s debt structure was an attractive 3.33% at the end of 2Q22. AvalonBay Communities (AVB) and Essex Property Trust (ESS) both have debt maturity schedules which mirror that of EQR with 23-25% of debt maturing over the next three years and over 40% of the debt load extended out to 2030 and beyond. UDR Inc. (UDR) manages its balance sheet at a bit higher level than its peers with a goal of 5.3x-5.7x consolidated net-debt-to-EBITDA, however its debt maturity schedule is quite conservative with just under 12% of total debt maturing through 2025 and almost 53% of the debt stack extending out through 2030 and beyond. UDR also did an exceptional job of locking in low rates for its longer maturity debt, contributing to a “sector-best” weighted average interest rate of 2.9%. ESS had total liquidity of $1.4 billion at the close of 2Q22 and a net debt to adjusted EBITDA ratio of 5.8x. ESS has also executed extremely well with the timing of their financings, bringing the weighted average interest rate on their $6.0 billion debt load down to 3.2%.
Sunbelt Apartments
The large sunbelt apartment names in the Top 10 are Mid-America Apartments (MAA) and Camden Property Trust (CPT) at an aggregate weight of 14% in the portfolio. Both companies are similarly rated at A3/A- for CPT and BBB+/A- for MAA. The term structure of CPT’s balance sheet is well laddered with just over 30% of debt maturing through 2025 and almost 45% of all debt extending out beyond 2029. The weighted average interest rate on all debt equaled 3.7% at the end of 2Q22 at a 6.4 year weighted average maturity. CPT also has a sizeable $1.2 billion of availability on its unsecured revolving credit facility. Net debt-to-adjusted EBITDA was a comfortable 4.4x and CPT has a massive unencumbered asset pool of approximately $19 billion. MAA completed 2Q22 with equally impressive balance sheet statistics with approximately 28% of total debt maturing over the next three years and 30% of total debt extending out beyond 2029. Weighted average interest rate and maturity were 3.4% and 8.2 years, respectively, at the end of 2Q22 and net debt-to-adjusted EBITDA stood at 4.0x.
Manufactured Housing Sector
The manufactured housing sector is well represented within the Top 10 holdings of HAUS with Equity Lifestyle (ELS) and Sun Communities (SUI) aggregating a 11.4% weighting. ELS boasts a rock-solid balance sheet with only 7.5% of total debt maturing through 2025 and this is inclusive of current outstanding borrowings on their line of credit. It is also impressive and noteworthy that 70% of their total debt matures in 2030 or beyond, providing the company with a sector leading 10-year average years to maturity. The weighted average interest rate on all debt is 3.5% and just over 20% of debt is fully amortizing, further reducing interest rate risk over the next several years. Total debt to adjusted EBITDA as of 2Q22 was 5.3x. SUI is rated BBB/Baa3 and has been one of the more acquisitive companies within our constituent universe over the past two years. As a result, SUI does have a higher percentage of total debt rolling through 2025, at 39%. This number is inflated by the $1.8 billion of unsecured revolving credit facilities which matures near the end of 2025. The company also has a large portion of their debt extending out through 2030, at 46%, and thus providing an overall 7.9 years to maturity, which is in-line with peers. The average interest rate across the debt capital stack was 3.4% at the end of 2Q22 and net debt to EBITDA was 6.3x (inclusive of the most recent acquisitions).
Single Family Rental REITs
Rounding out the Top 10 holdings are two single-family rental REITs, American Homes 4Rent (AMH) and Invitation Homes (INVH) which constitute a combined 13% of the fund. AMH was recently upgraded to BBB by S&P Global and carries a Baa3 rating from Moody’s. At 2Q22, AMH held an impressive liquidity position of $1.8 billion, including $70 million of unrestricted cash, $1.25 billion of undrawn capacity on its revolving credit facility and $489 million of expected net proceeds from forward equity shares. Net debt and preferred shares-to-adjusted EBITDA stood at 6.2x. Total debt of the company stands at $4.5 billion, with 22% maturing through 2025, and almost 77% extending to 2028 or beyond. INVH is rated BBB-/Baa3 and had total debt of $7.8 billion at the end of 2Q22. While the company only has 7.3% of total debt maturing through 2025, they do have several large maturities in 2026, constituting 40% of total debt and just under 30% extending out past 2031. Given the 2026 maturities, INVH has a modestly shorter weighted average years to maturity than other residential REITs at 5.8 years and carries a weighted average interest rate on total debt of 3.6%. Net debt-to-adjusted EBITDA was 5.9x for the past quarter.
HAUS Top 10 - Debt Analysis Chart
Outlook
In summary, we remain confident that residential REIT operating fundamentals will meet the lofty expectations set for the balance of 2022 and are well positioned to handle the “normalization” phase of the apartment cycle which will come in 2023. Apartment rent growth has historically matched inflation over the course of an economic cycle and given the economic underpinnings of the current environment, coupled with strong property level operating metrics across many markets, we believe that revenue growth and net operating income will perform well in coming quarters. The debt and liquidity characteristics described above give us comfort that these companies were aggressive and prudent to take advantage of the low interest rate environment of 2021/early 2022, thus providing the financial flexibility to manage through turbulent times as conditions potentially change for the worse.[1]
Definitions:
EBITDA stands for earnings before interest, taxes, depreciation, and amortization that is used as an indicator of the overall profitability of a business.
Consolidated Net-Debt-EBITDA: On any date of determination, the ratio of (a) Consolidated Net Debt on such date to (b) EBITDA for the one-year period ending on such date.
Net Debt To Adjusted EBITDA: Means at any date of determination, the ratio of Net Debt as of the last day of the most recently ended fiscal quarter to Adjusted EBITDA for the most recently ended four fiscal quarters.
Debt To Adjusted EBITDA: is a ratio measuring the amount of income generated and available to pay down debt before covering interest, taxes, depreciation, and amortization expenses.
Net Debt And Preferred Shares-To-Adjusted EBITDA: Companies will also include the preferred shares outstanding in the calculation, thus making the numerator...."net debt and preferred shares" divided by "adjusted EBITDA" as the denominator. Essentially treating the preferred shares as another form of debt for this particular calculation.
Footnotes:
[1] Financial disclosures including 10-Q, supplemental earnings reports and company presentations
Disclosures:
Quality ratings reflect the credit quality of the underlying securities in the Fund’s portfolio and not that of the fund itself. Quality ratings are subject to change. The credit quality rating listed first is S&P. S&P assigns a rating of AAA as the highest to D as the lowest credit quality rating. The credit quality rating listed second, is from Moody’s. Moody’s assigns a rating of Aaa as the highest to C as the lowest credit quality rating.
Investors should consider the investment objectives, risks, charges and expenses carefully before investing. For a prospectus or summary prospectus with this and other information about the Fund, please call (800) 693- 8288 or visit our website at www.armadaetfs.com. Read the prospectus or summary prospectus carefully before investing.
Investments involve risk. Principal loss is possible
Distributed by Foreside Fund Services, LLC.